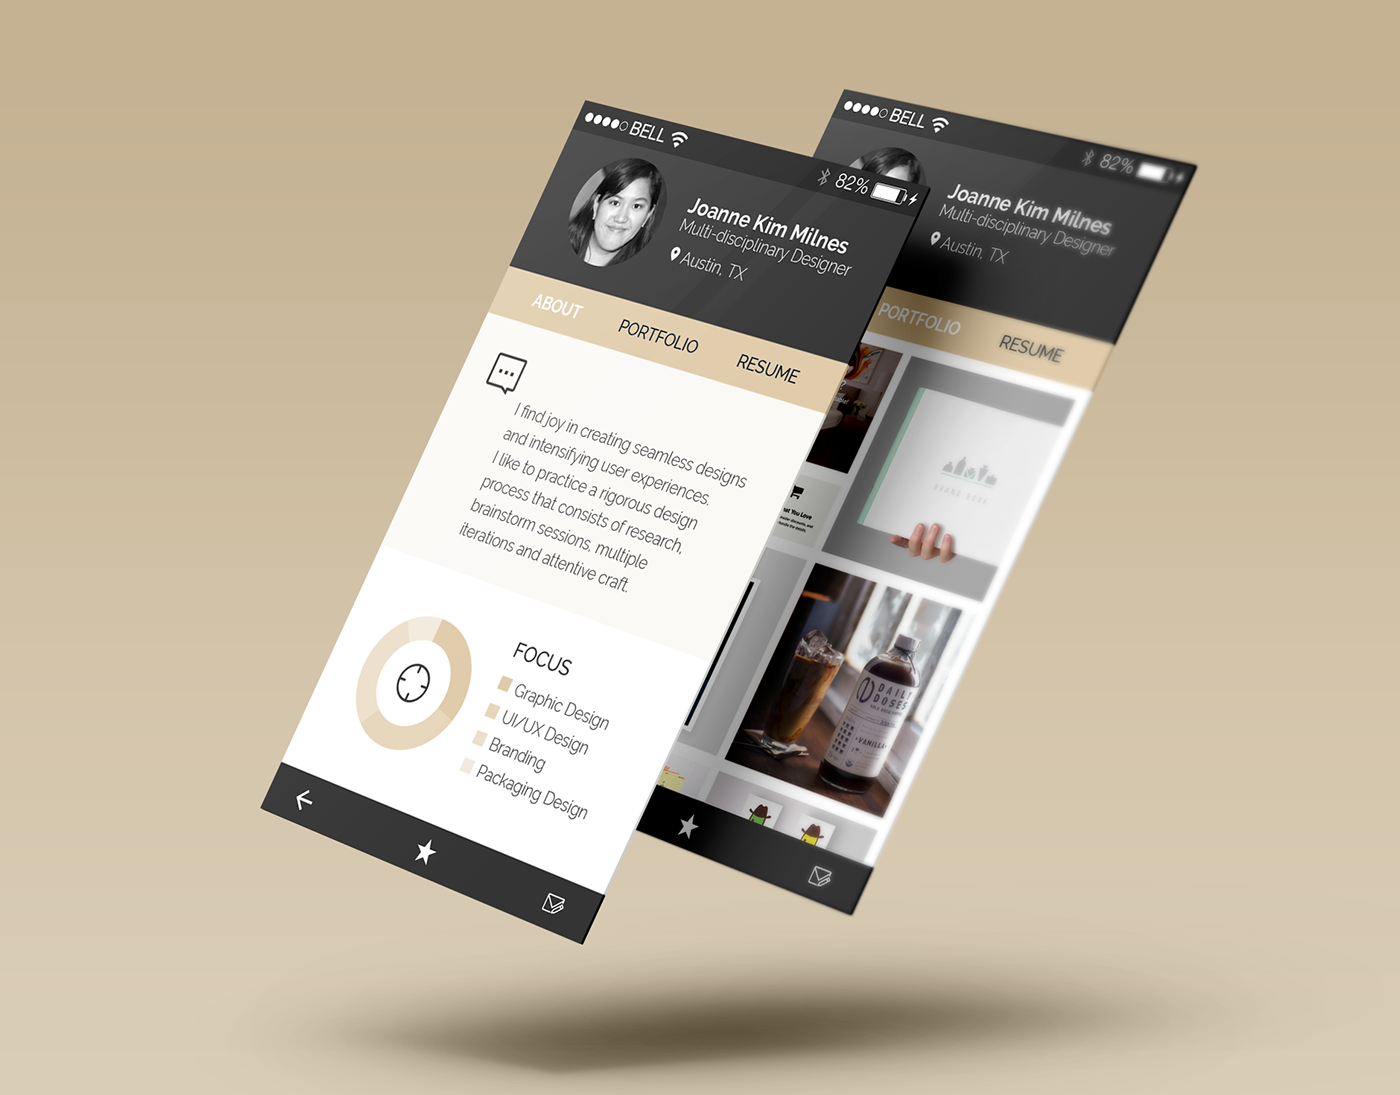

Project type: Design project at MineralSoft, Enverus
Project length: 2 months
My role: Product Designer
Collaborators: Product manager, developers, (internal) operation team members, customers
Project length: 2 months
My role: Product Designer
Collaborators: Product manager, developers, (internal) operation team members, customers
The ability to run reports and analyze data in Excels and PDFs is highly valuable to our customers. Our reports allow customers to quickly gather insights on revenue in any period for any oil & gas assets that they own. These insights help the mineral managers to understand trends and make decisions about their investments.
However, our report module is a source of ongoing confusion and frustration for our customers. After hearing repeated complaints about our report module, I reimagined the user experience of report generation and customization.
High-level Project Goals:
1. Make it easy for users to find the reports they want to run.
2. Make it easy for users to customize the reports.
3. Explore and validate new report-related features to increase customer satisfaction.
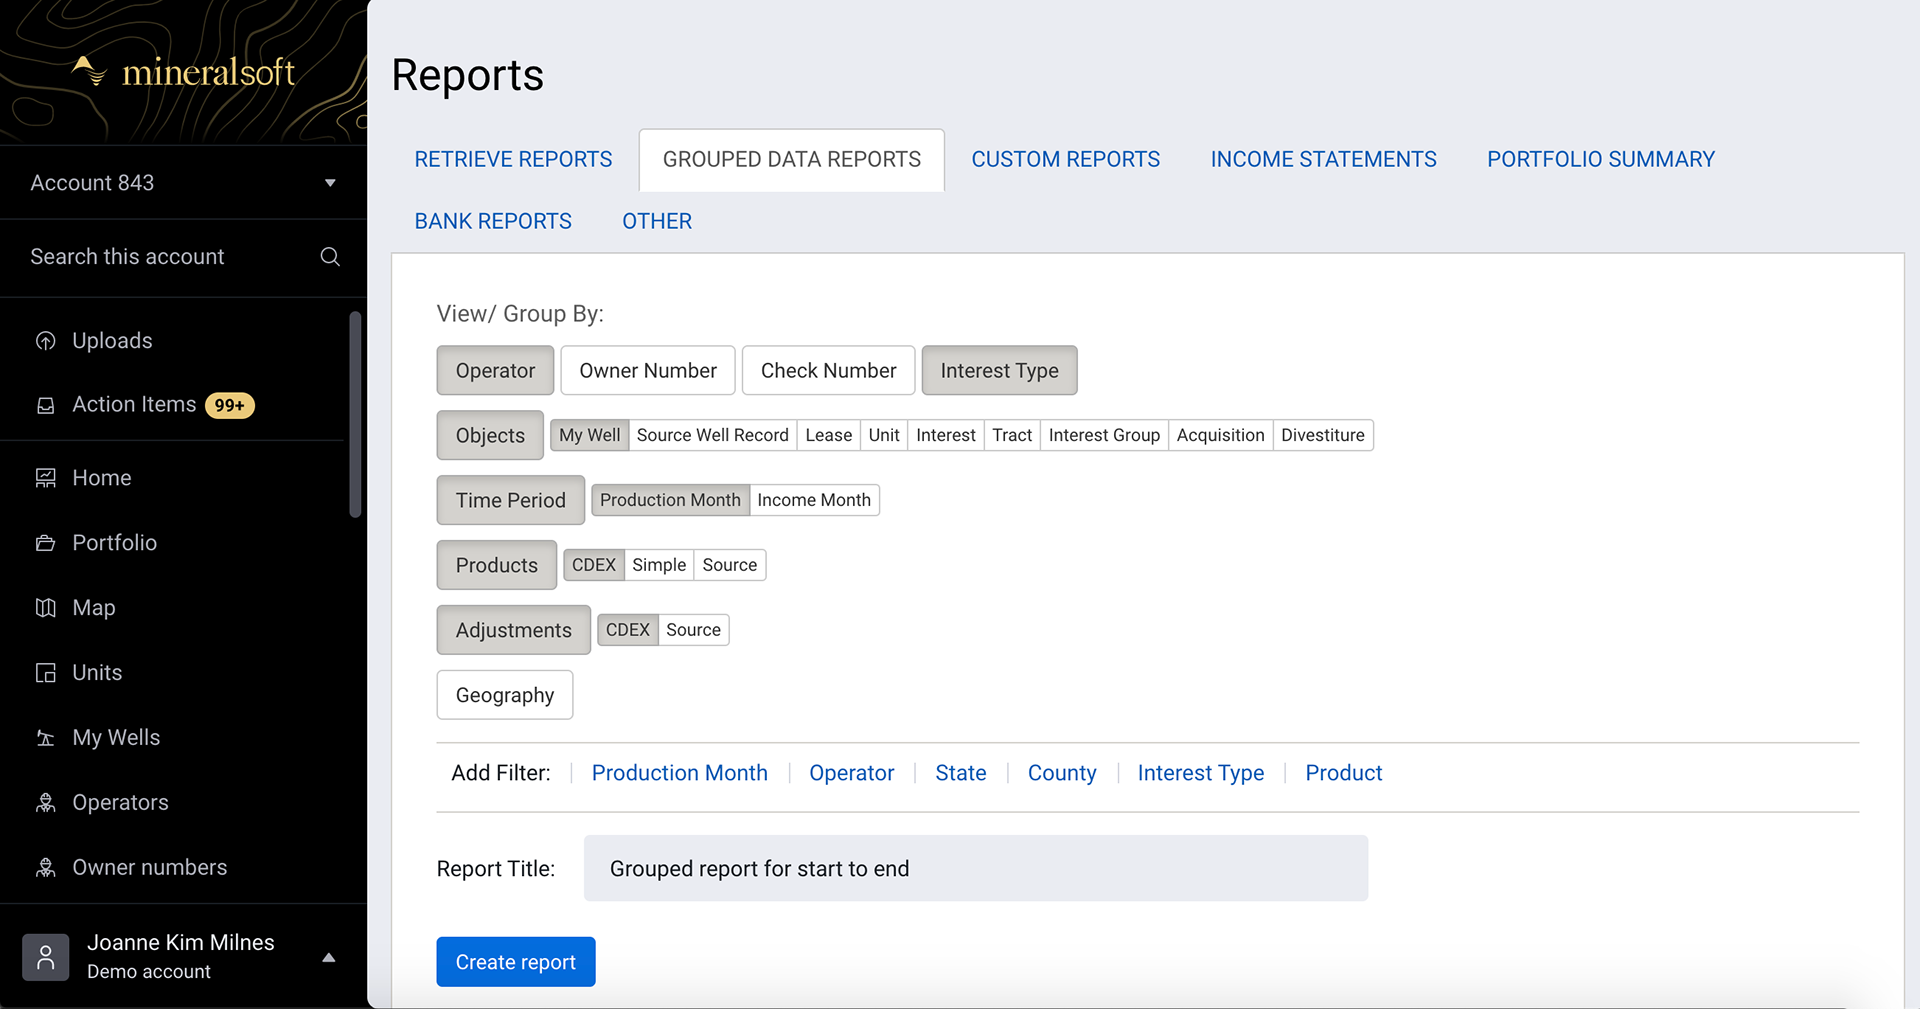
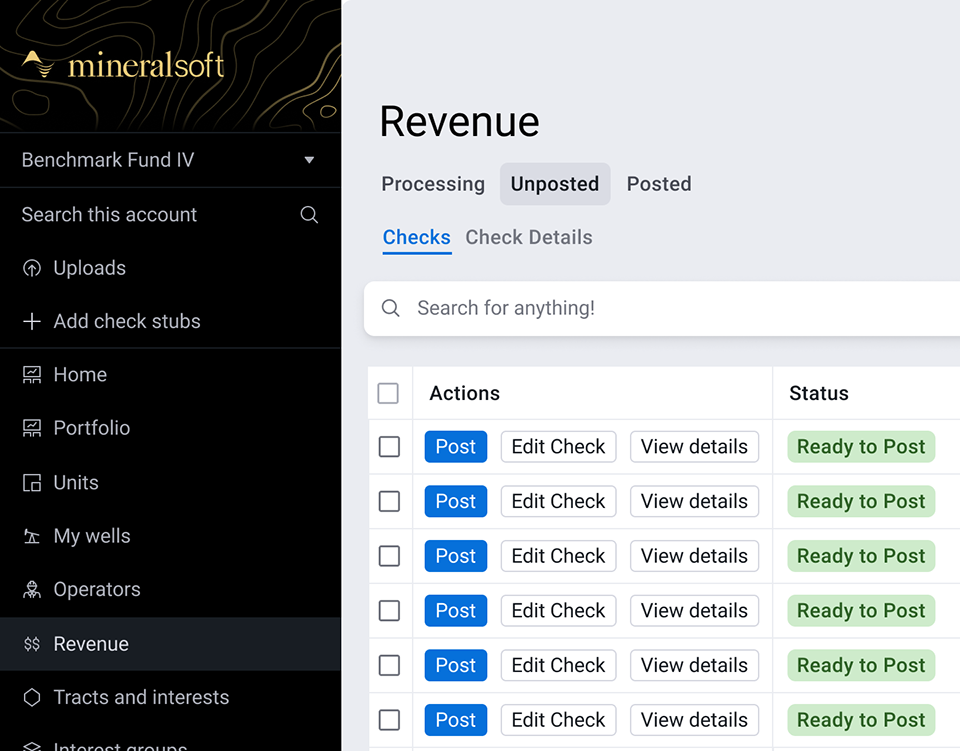
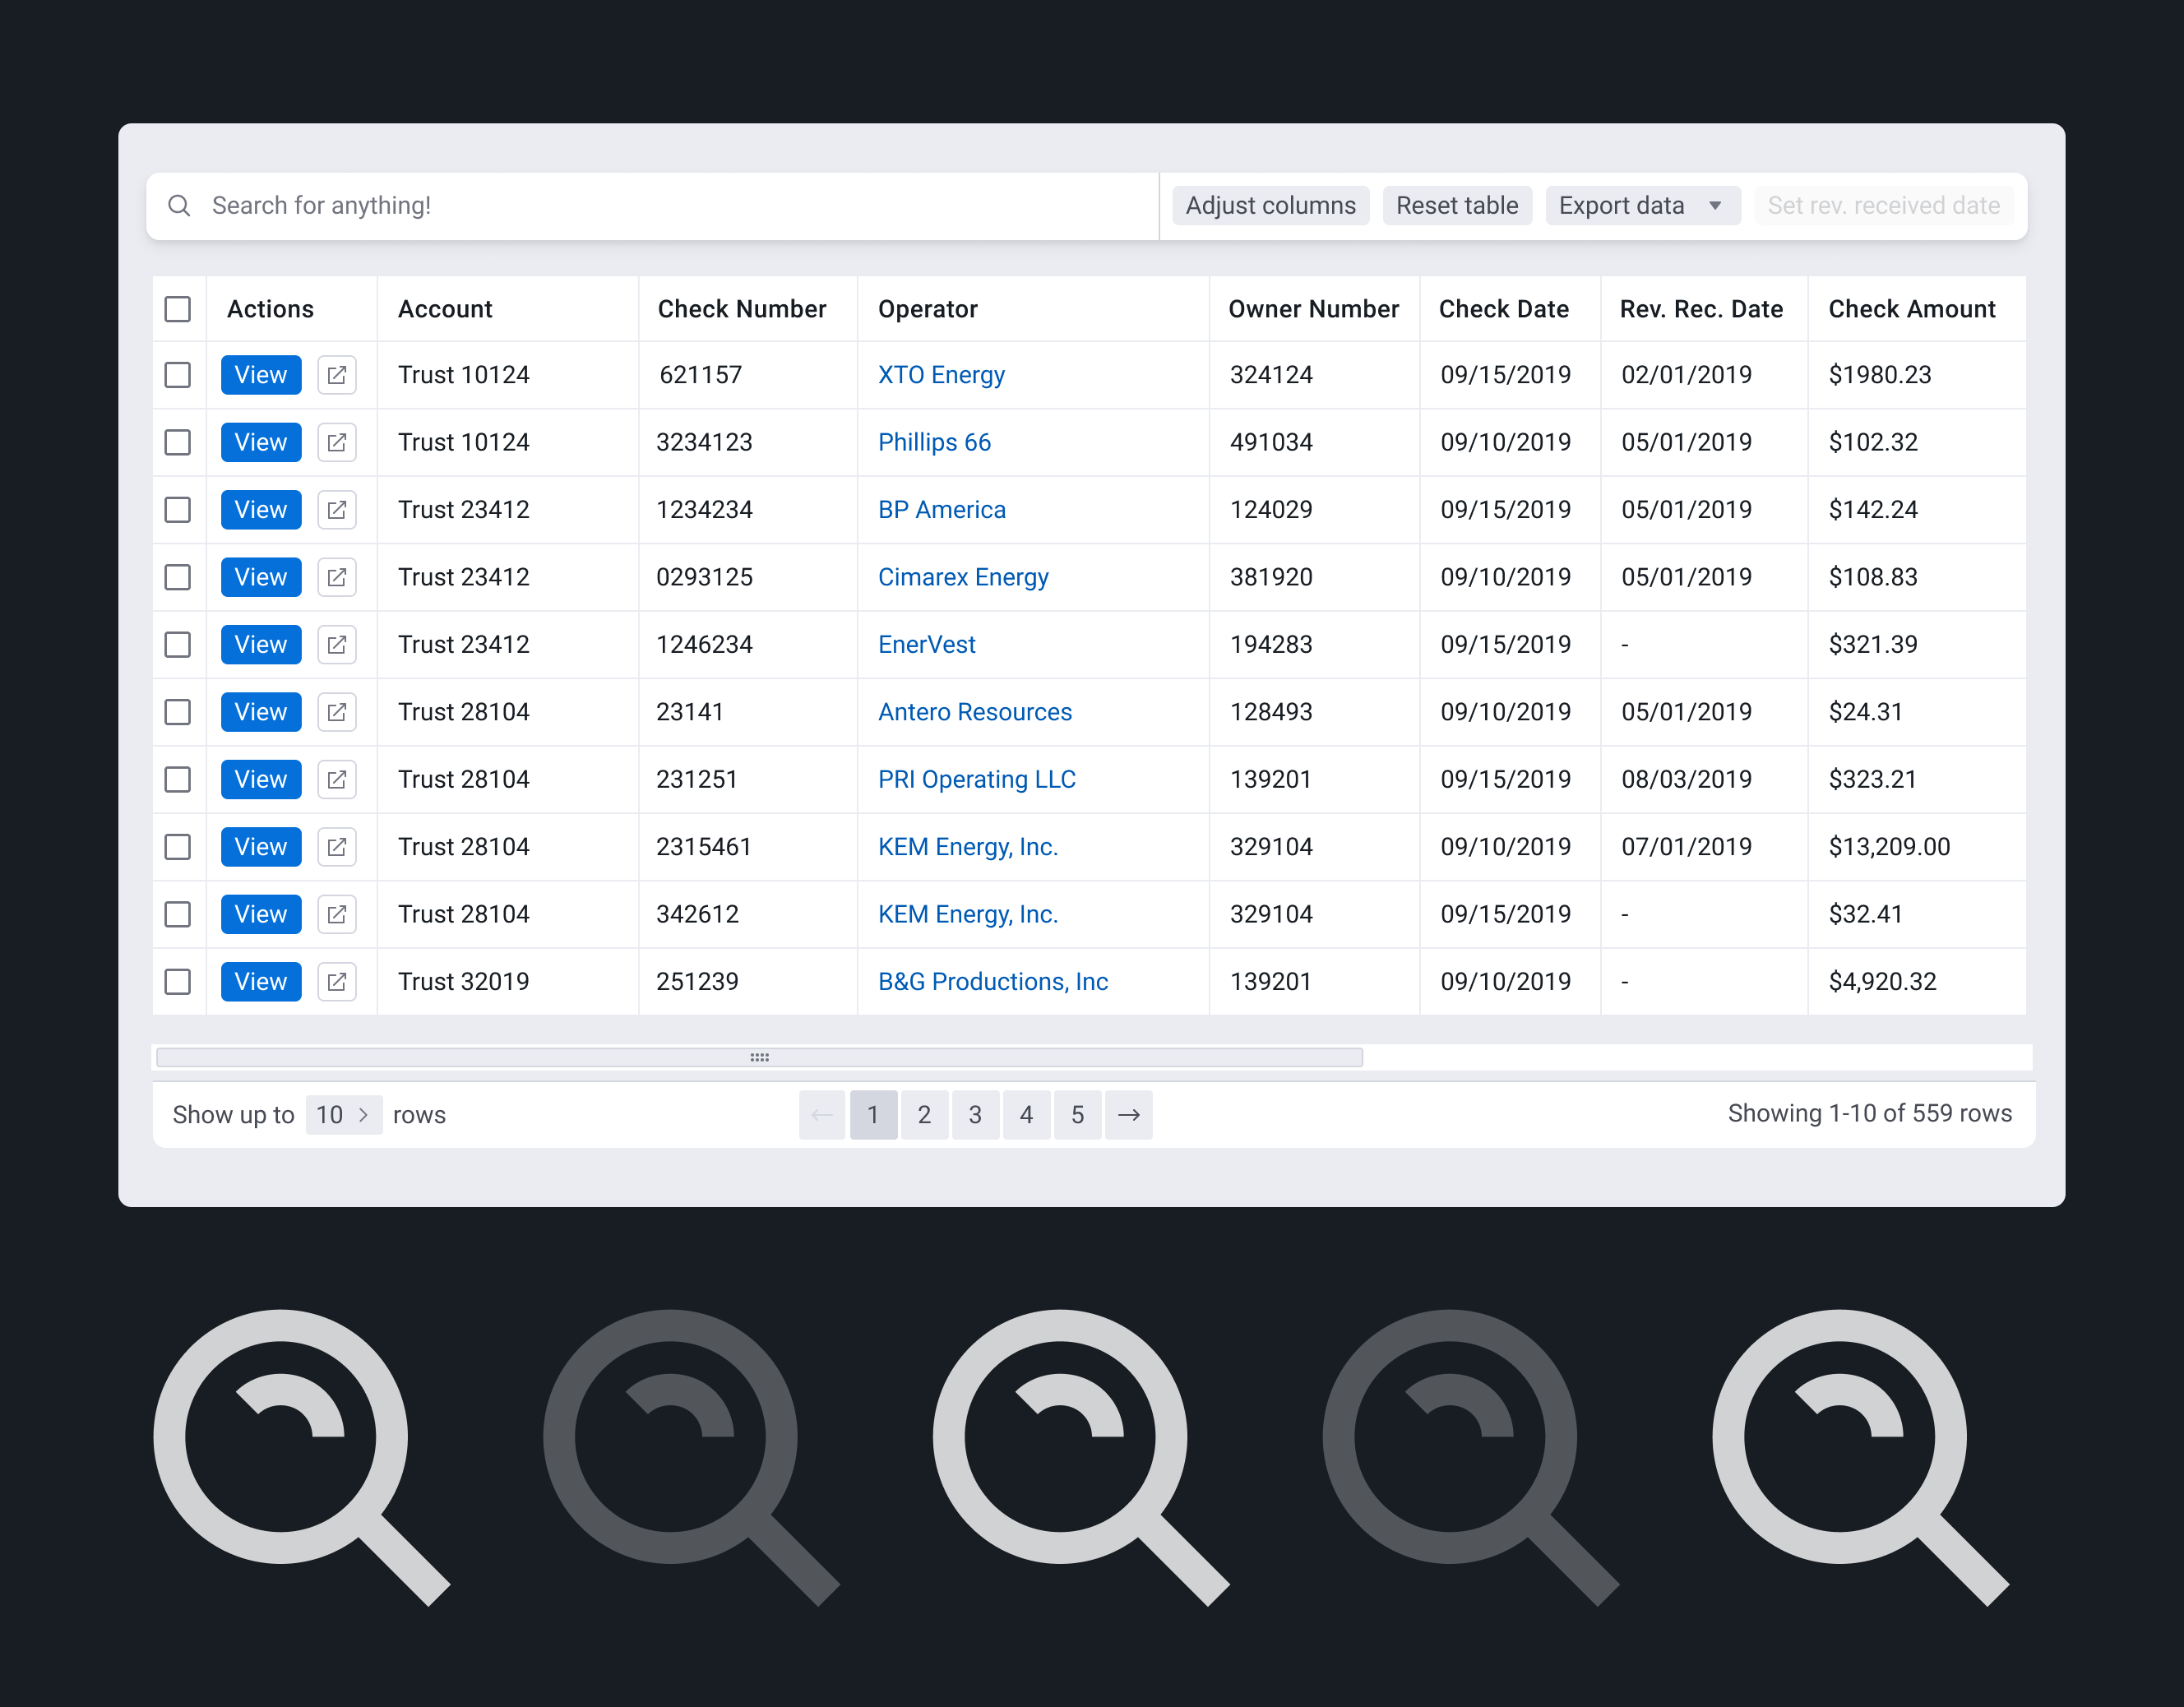
The current user interface of the Reports Module (Before Design)
Defining the Problems
To develop the right solutions, I found it necessary to define the problems in small approachable chunks. So, first, I interviewed a few of our internal team members in the Operations, Sales, and Product departments to learn about their perceived issues with reports. Then I reached out to a few of our customers I knew ran the most reports in the last six months.
I was aware that there were different reasons for running reports. For example, accountants run Excel reports and use pivot tables to analyze their revenue. Asset managers run the PDF reports to present and share the quarterly or annual revenue with their customers. So I made sure to include both personas in my list of interviewees.
Through the interviews with internal team members, I learned that many customers couldn't easily figure out which reports would solve their business problems. So, we were getting a lot of requests for training on reports.
Through the customer interviews, I learned many more insights, and here are some key takeaways.
1. Customers find it difficult to imagine what a report will look like before it's generated.
2. Customers find our options and filters challenging to figure out. It's simply not intuitive to customize reports.
3. Some of our reports are limited in customization. Customers want more filters and options. Some also want to select, hide, and order the columns.
4. Customers found inconsistent UI components to be confusing. Questions such as "When the button turns gray, does it mean it is selected?" came up a lot.
5. Some of the business problems could be solved through other product areas, but customers weren't aware and looking for answers through reports.
6. Many customers were familiar with creating reports in other applications and compared the experience. Salesforce was mentioned a few times.
Lastly, the product team continued to face a challenge with an increasing number of horizontal tabs. These tabs are not well organized, and we kept running into an issue of "Which tab do we add this new report to?" This is directly correlated to the problem of the user's discovery of relevant reports.
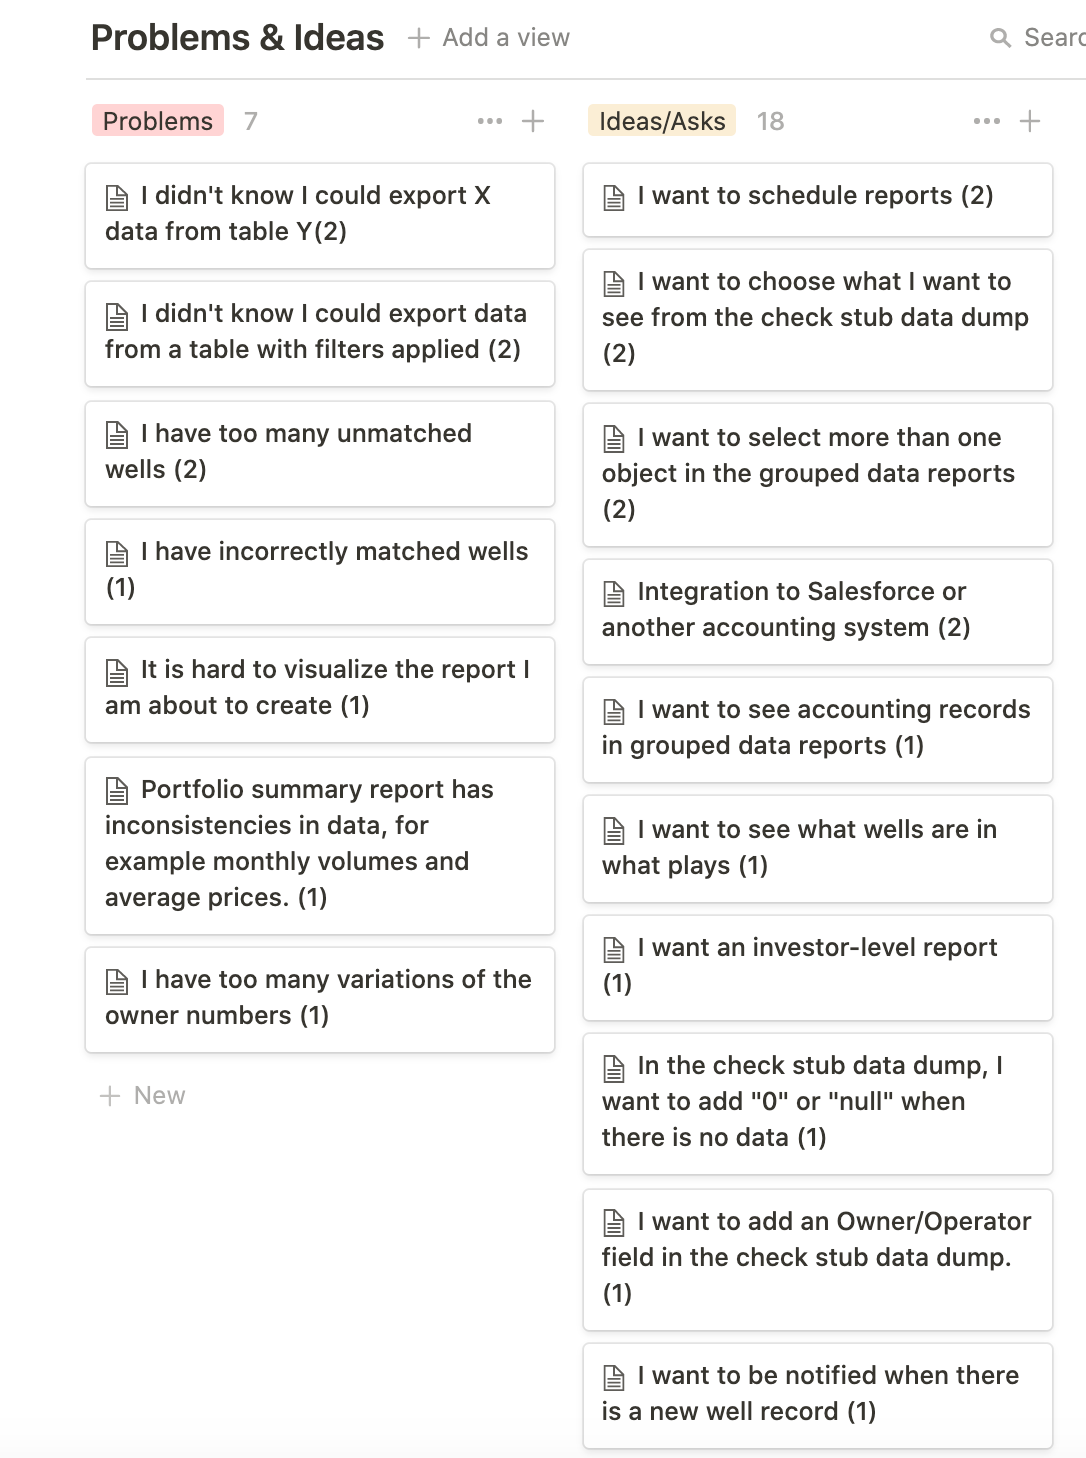
Working documentation of customer insights
By the end of the interviews, I gathered many more problems than I initially intended to tackle. So I had to focus on my project goals and not get distracted. Nonetheless, we generated a lot of ideas to improve the overall reporting experience.
Here are some of those user stories.
● I want to re-order columns and define sorting in the report so that I can further customize my report.
● I want to see the report details (options, filters, and other metadata) before downloading a completed report so that I can be quickly reminded about the report I created.
● I want to save the report configurations so that I don't need to customize a report that I run regularly each time.
● I want to create reports on a recurring schedule and receive them via email so that I can save time.
● I want to share a report link within the organization so that I can skip the step of downloading and sharing a report via email or other means.
● I want to create my own report by defining groups and dragging columns and rows so that I'm not restricted to skeletons that MineralSoft provides.
● I want to add more data visualizations (graphs + charts) to reports so that the data is more presentable and easily understood by my audience.
Designing & testing the New Reports Module
I started by tackling the bigger navigation problem and reimagined the new report generating experience. This new user flow will allow the product team to add a new report type as a card easily. A card includes a summary and available formats, which will give the user an idea of what a report looks like from the start. One day, we would love to display the preview of the report with the user's actual data, but for MVP, we decided that a simple image of the sample report would do. We also tabled the idea of adding graphs and charts to the reports for now.
I presented each report's customization screen with advanced options and filters to satisfy the users with the need for customization without overwhelming the users who wanted to run reports quickly. I also recognized that consistent use of components would also be a key to enhancing usability.
Lastly, I tested new functionalities such as favoriting reports and scheduling reports. I knew these highly requested features wouldn't be on our immediate roadmap, but I still wanted to present them as part of our vision for the new Reports module.
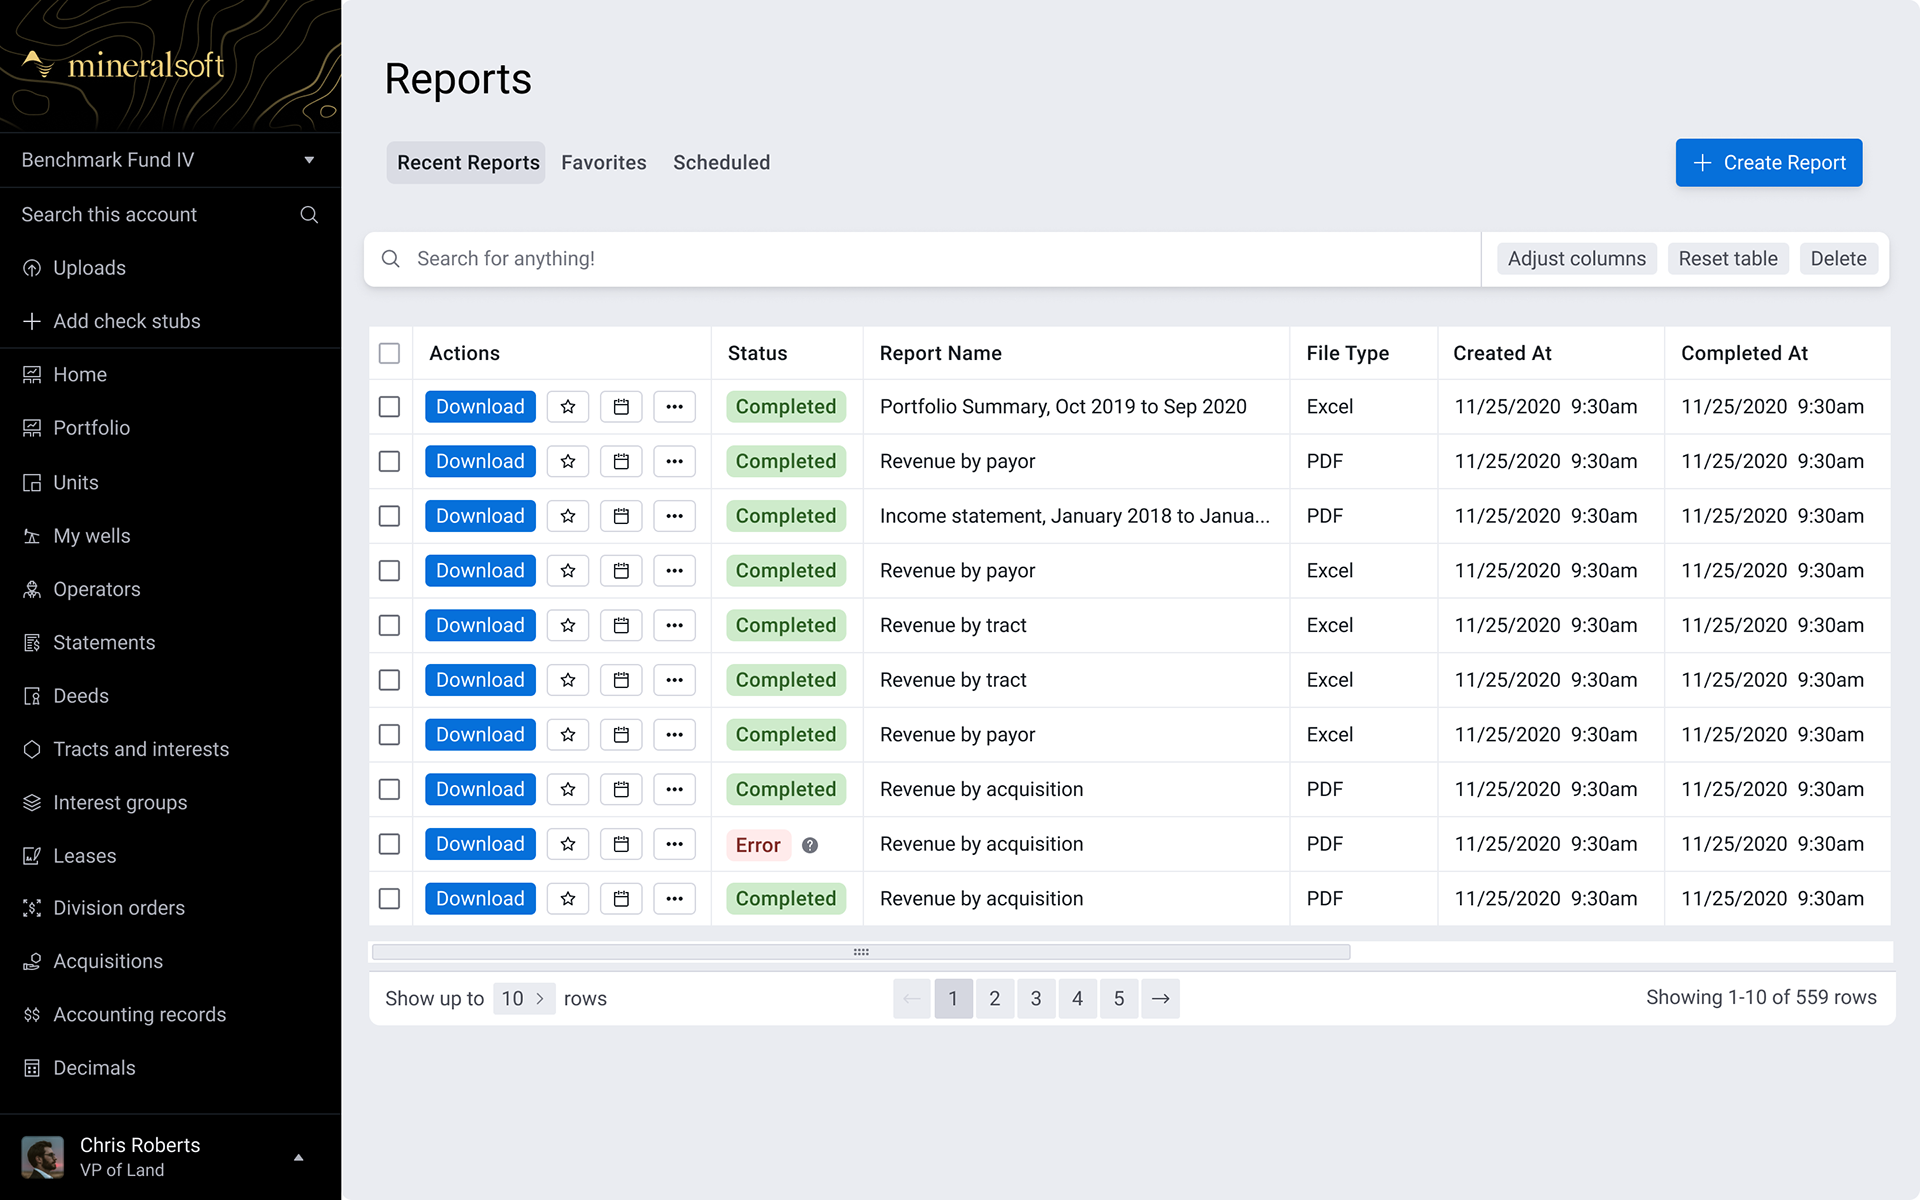
Main tab to retrieve recent reports
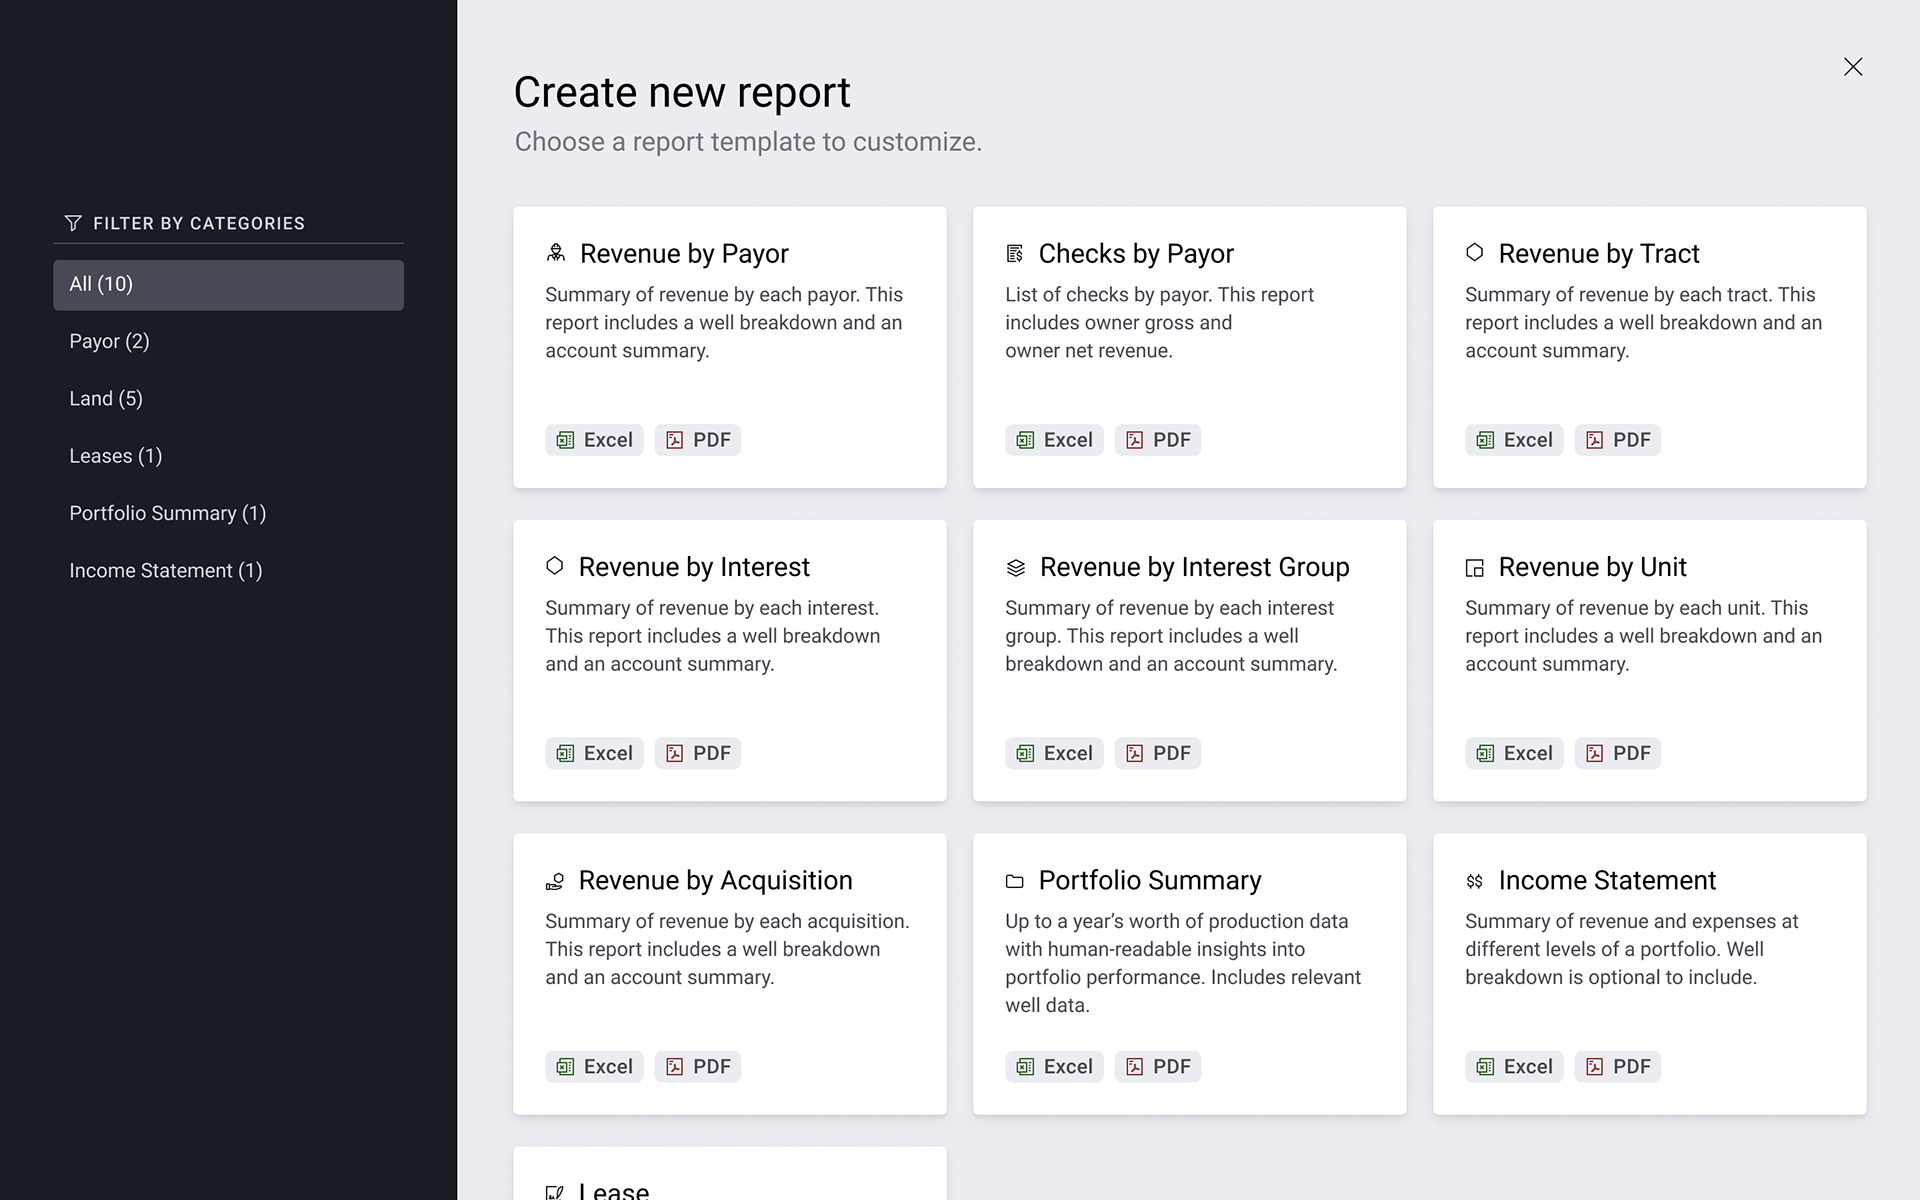
Reports library screen with cards
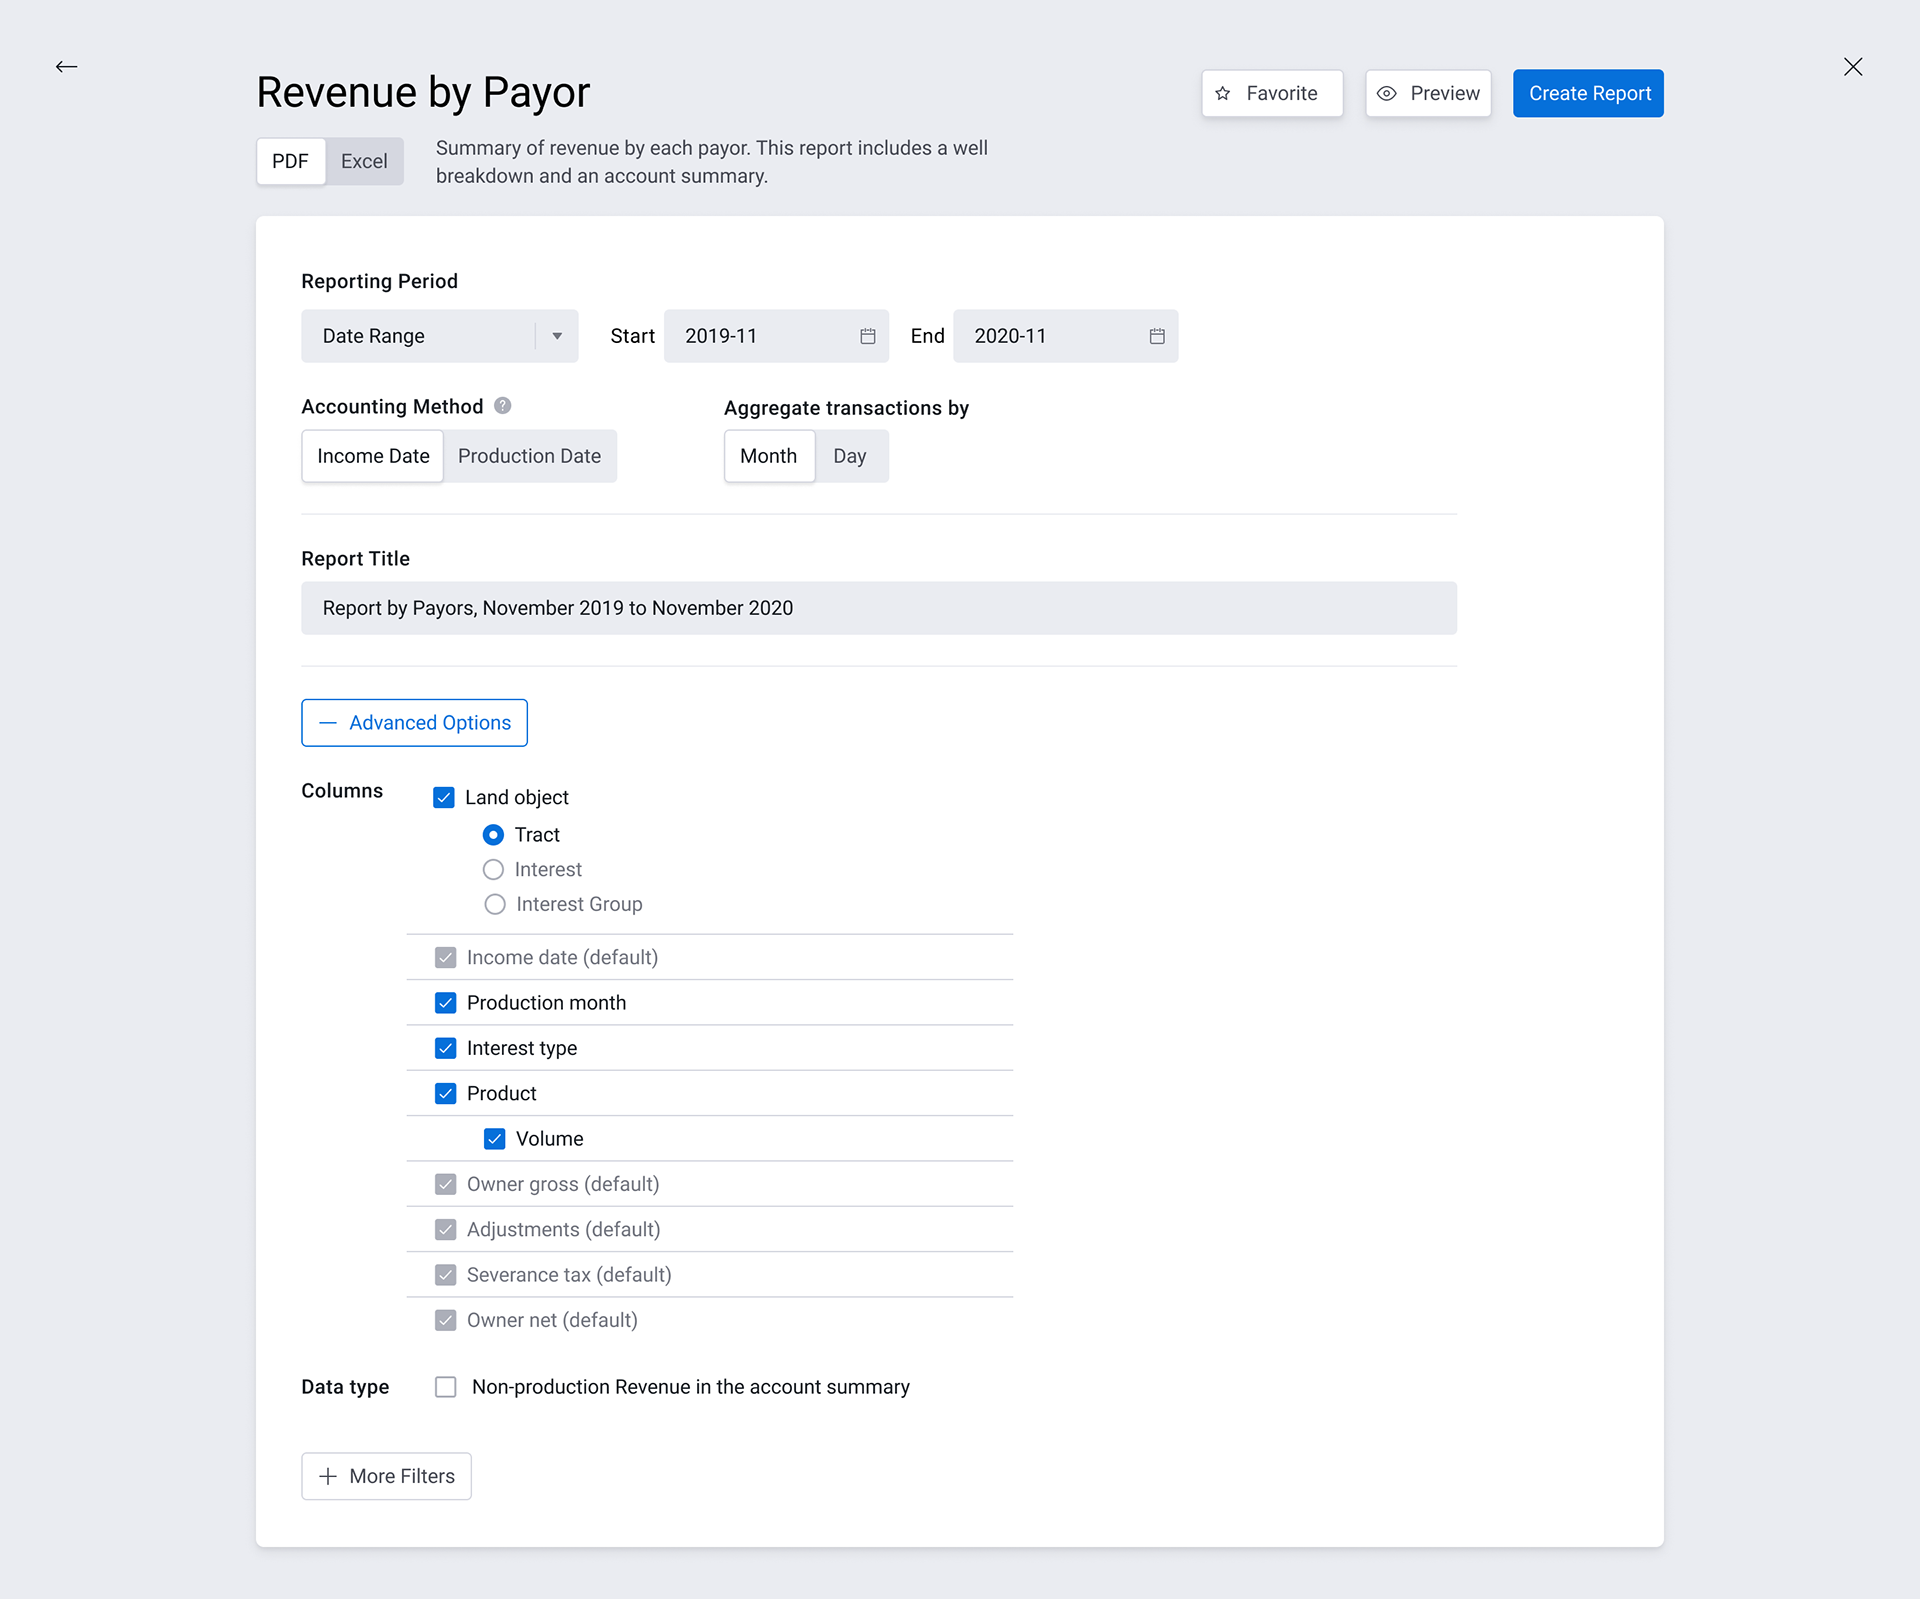
Customization screen with advanced options and filters

Preview of the report (MVP)
After creating a clickable design prototype, I reached out to the customers we previously talked to and got further feedback. For example, I had "a quick view" overlay of the card to give a more detailed explanation of the report. But many users found it confusing and asked how to generate the report. So I decided to remove this screen and took users straight to the customization screen instead.
One area I didn't spend a ton of time but wish I had is defining the reports' categories. It would be nice to run through a card sorting exercise to generate the categories that make the most sense to our customers.
Final Thoughts
I received great enthusiasm for the project from presenting the prototype to the product & engineering teams. Development work on this project has not started, but I believe these improvements will significantly improve the engagement with our reports. To track the success of this project, I would keep an eye on the increased number of reports created, the decreased number of requests for training on reports, and our customer satisfaction rate (NPS score). The product team realizes that creating consistent report templates will have to be developed over time. So, we intend to do more research on the most popular reports and start with them.